
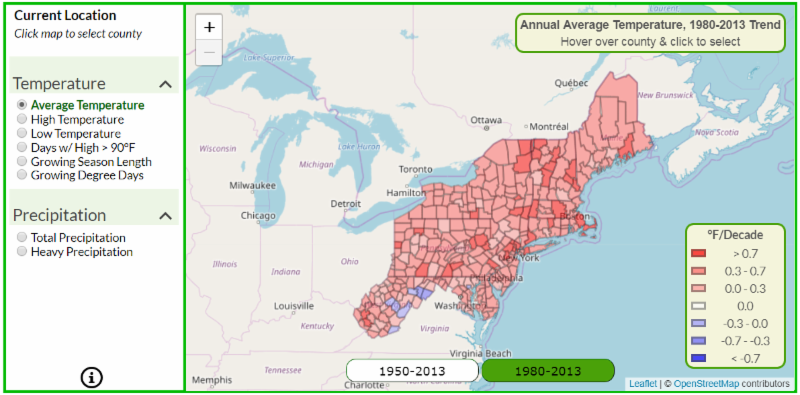
The Bay Journal reported recently on a new tool displaying climate changes at the county level for most of the Chesapeake watershed and the northeast US. An interactive map allows the user to hover over a county and see trends in temperature, precipitation and growing season.
The patterns are pretty clear. As Bay Journal notes: “climate data ranging from 1950-2013 in each county underscores that the vast majority of the watershed is getting hotter and rainier.” A few examples cited by the Journal:
- In Franklin County in south-central Pennsylvania, the average annual temperature has risen at a rate of 0.3 degrees Fahrenheit per decade since 1950. But that rate jumps to 0.7 degrees when measured since 1980, suggesting things are getter hotter faster.
- In Maryland’s Prince George’s County, the typical low temperature has warmed up a full 1 degree per decade since 1980.
- In New York’s Chemung County, average annual precipitation increased at a rate of 2.3 inches per decade from 1980-2013.
The tool also provides county by county climate projections through 2100 based on either high or low carbon dioxide emission models. “For example,” writes the Journal “the annual average temperature in Frederick County, MD, is predicted to increase from 52.6 degrees in 2013 to 60 degrees by the end of the century under the low-emission scenario or soar to 64.9 degrees assuming high emissions persist.”
Developed by Cornell University’s Department of Earth and Atmospheric Sciences, the tool supports farmers, but seems broadly relevant to conservationists. Aside from how can we act to reduce emissions, one might also ask: how should trends influence where farm land is conserved? Or where habitat is protected to sustain biodiversity?