
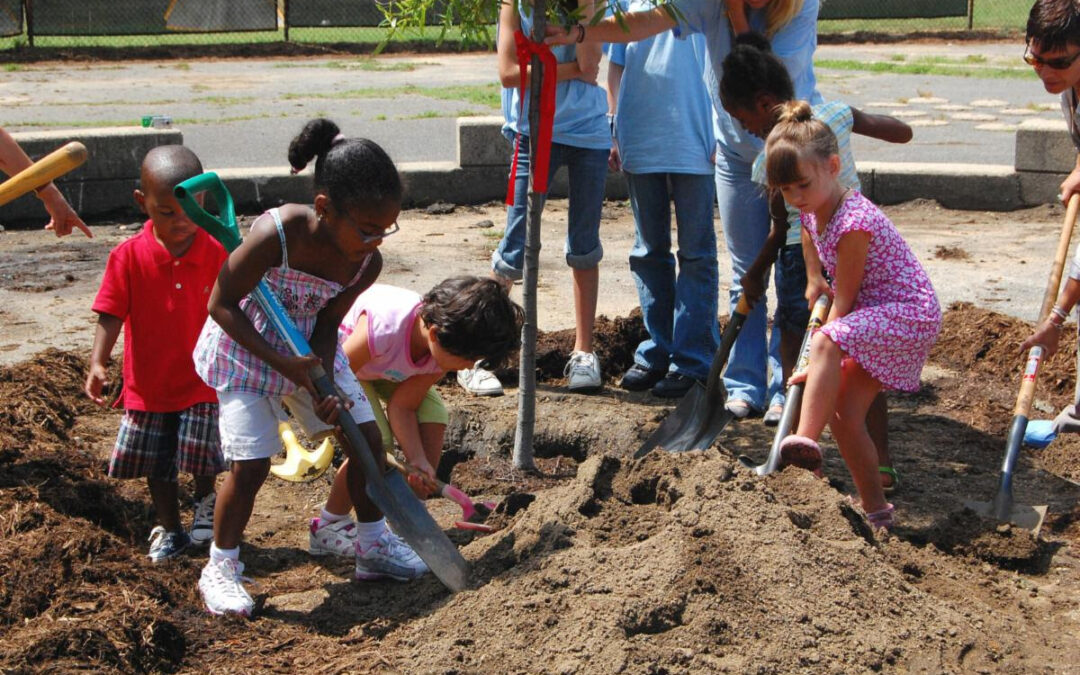
Students from Tyler Elementary School in Washington, D.C., receive help planting a tree.
Photo credit: Will Parson / Chesapeake Bay Program
Written by Rachel Felver; Alliance for the Chesapeake Bay & communications director for the Chesapeake Bay Program.
Over a decade ago, the Chesapeake Bay Program invested in the development of cutting-edge technology that would forever change the way in which the landscape of the Chesapeake Bay watershed would be viewed. These one-meter by one-meter datasets, developed by the Chesapeake Conservancy, University of Vermont and Worldview Solutions, Inc., provide 900 times more detail of the land than previous watershed-wide data. The first dataset reflects data mapped in 2013-14, while the most recent dataset was mapped in 2017-18. The observed changes in land use and land cover between these two time periods make up the Land Use/Land Cover Change Tool, the first of its kind in the Chesapeake Bay region.
We always knew these data would help evaluate progress toward reducing the amount of nutrient and sediment pollution flowing into the Chesapeake Bay—but now this technology is being used to provide critical insights into how the land of the 64,000-square-mile watershed is being used, as well as how it is changing over time. These insights empower the work of land conservation professionals.
Case in Point: A Pulse on Tree Canopy
In spring 2022, a brand-new land use and land cover dataset was released, along with the first Chesapeake Bay land change tool, showing how the landscape of the watershed had transformed in the time period between 2013-14 and 2017-18. This information is now being used to provide a better understanding of the gain and loss of tree canopy and the increase of impervious surfaces across the watershed.
Impervious surfaces refer to any area that blocks the natural filtration of water, such as parking lots or streets. When it rains, water should be soaked up by tree roots, wetlands or the soil. Instead, impervious surfaces allow water to simply run off, picking up trash, chemicals, sediment and nutrient pollutants along its way to the nearest water body. Between 2013-14 and 2017-18, the Land Use/Land Cover Change Tool found that 79.1 square miles, or 50,624 acres, of impervious surfaces were added across the Chesapeake Bay watershed. The fastest developing land areas can be found around Baltimore, Maryland; Harrisburg, Pennsylvania; Richmond, Virginia; and Washington, D.C.
Of these 50,624 acres, roads make up 4.1%, while buildings account for 31.6%. But the largest source of these impervious acres is attributed to the “Other” category, which includes driveways, parking lots and areas that have been cleared for development.

The Land Use/Land Cover Change Tool can provide a snapshot of data relevant to a specific county anywhere in the Chesapeake Bay watershed, such as Lancaster County, Pennsylvania. Photo Credit: Chesapeake Conservancy’s Conservation Innovation Center.
The high-resolution land use and land cover data also helps us to understand the loss of tree canopy across the Chesapeake Bay region. While 8,307 acres of trees have been planted across the Chesapeake Bay region between 2013-14 and 2017-18, the Land Use/Land Cover Change Tool found that over 25,000 acres of tree canopy has been lost in community areas (defined as municipalities, cities, towns, villages and boroughs by the U.S. Census).
To track real-time progress that each watershed jurisdiction—Delaware, Maryland, New York, Pennsylvania, Virginia, West Virginia and the District of Columbia—is making in planting trees to increase their canopy, the Chesapeake Bay Program uses annual data that is reported under the Chesapeake Bay Total Maximum Daily Load, or Bay TMDL. Since this data only captures gains in tree canopy, the high-resolution land use and land cover data helps to assess losses.
This is a powerful tool in the toolbox for land conservation professionals. Understanding tree cover status and change could help trusts and agencies prioritize parcels to conserve, help communities and nonprofits rally support for conservation and show the environmental value of the land for conservation.

Maps, such as the one above for Lancaster County, Pennsylvania, can be produced by the tool which effectively demonstrate areas of tree canopy loss and tree canopy gain. Photo Credit: Chesapeake Conservancy’s Conservation Innovation Center.
If you are interested in learning what the tree canopy and impervious surface cover looks like in your county, the Chesapeake Bay Program Forestry Workgroup used the high-resolution land use and land cover data to create Tree Cover Status and Change fact sheets. These fact sheets, one for each county in the Chesapeake Bay watershed, provide the percentage of the county covered by trees, impervious surfaces, forests and turf grass (i.e., lawns) while using data from i-Tree Landscape to provide an analysis of the environmental benefits offered by trees in the region.
The loss of trees and increase in impervious surfaces is not good news by any stretch of the imagination. Trees are giant sponges, capturing rainfall, trapping polluted runoff and stabilizing soil. They produce oxygen while trapping and absorbing air pollutants. They keep air and water temperatures cool, helping to combat urban heat islands. They’ve been proven to aid both physical and mental health, increase property values, generate jobs and income, lower energy costs and foster outdoor recreation.
Funding and Support for Planting More Trees
But we shouldn’t despair yet. While Maryland had the greatest loss in tree canopy, they also reported the largest number of community tree plantings at 6,501 acres. In 2021, their General Assembly passed legislation calling for the planting and maintaining of five million native trees in the state by 2031.
In 2018, the Keystone 10 Million Trees Partnership set a goal to plant 10 million trees across the Commonwealth of Pennsylvania by 2026. By November 2022, they were over halfway to their goal. And in Delaware, their governor set a goal in 2022 to plant one million trees—or A Tree for Every Delawarean.
The recent Infrastructure Investment and Jobs Act has allowed the U.S. Forest Service (USFS) and the Environmental Protection Agency (EPA) to finance multiple projects across the watershed to increase tree plantings. Over the past two years, the EPA has funded $9.6 million in projects to increase tree plantings in both agricultural and urban landscapes, while the USFS will invest $1.5 billion in the coming years to support urban and community forest efforts not only in the Chesapeake region but nationwide.
Tree Canopy and Land Use Policy and Prevention (i.e., measure of impervious surfaces) are two outcomes under the Chesapeake Bay Watershed Agreement, and you can track the real-time progress toward meeting their goals at www.chesapeakeprogress.com.
Lightning Update is a regular communication of the Chesapeake Conservation Partnership. Any opinions expressed are those of the authors and do not necessarily reflect positions of the Partnership or member organizations.
To share a success story, news, or important event, send your information to:
Support for the Chesapeake Conservation Partnership is provided by:
National Park Service Chesapeake
EPA Chesapeake Bay Program
USDA Forest Service
Pennsylvania Department of Conservation & Natural Resources
Maryland Department of Natural Resources
Virginia Outdoors Foundation
US Fish & Wildlife Service
Chesapeake Conservancy
The Chesapeake Conservation Partnership is co-convened by:

")